
I'd rather hand you the awkward part straight, because you'd find it anyway: over the last 5 years, just holding SPY made more money than my system. Not a little more, either. Almost twice the gain.
So why do I still trade Larry Connors and Cesar Alvarez's RSI(2) pullback? One word: drawdown. Here's the case, in numbers you can check.
The rules
They come from their 2008 book, Short Term Trading Strategies That Work, and I run them on SPY's daily chart exactly as written:
Trend first. I only play while SPY closes above its 200-day average, because a pullback in an uptrend is a gift and a pullback in a downtrend is a trap.
Buy the panic. When the 2-day RSI closes under 10, I buy the close.
Sell the bounce. The first day SPY closes back above its 5-day average, I'm out at the close.
Nothing else. No stop, long only, and the rest of the time I sit in cash.
That last line does the heavy lifting: I'm in the market only about 1 trading day in 8.
The money
I gave both sides the same $10,000 on Nov 15, 2021 and charged costs on every fill. By Nov 13, 2026, SPY had turned it into a little over $16,000, while my system stopped near $13,500.
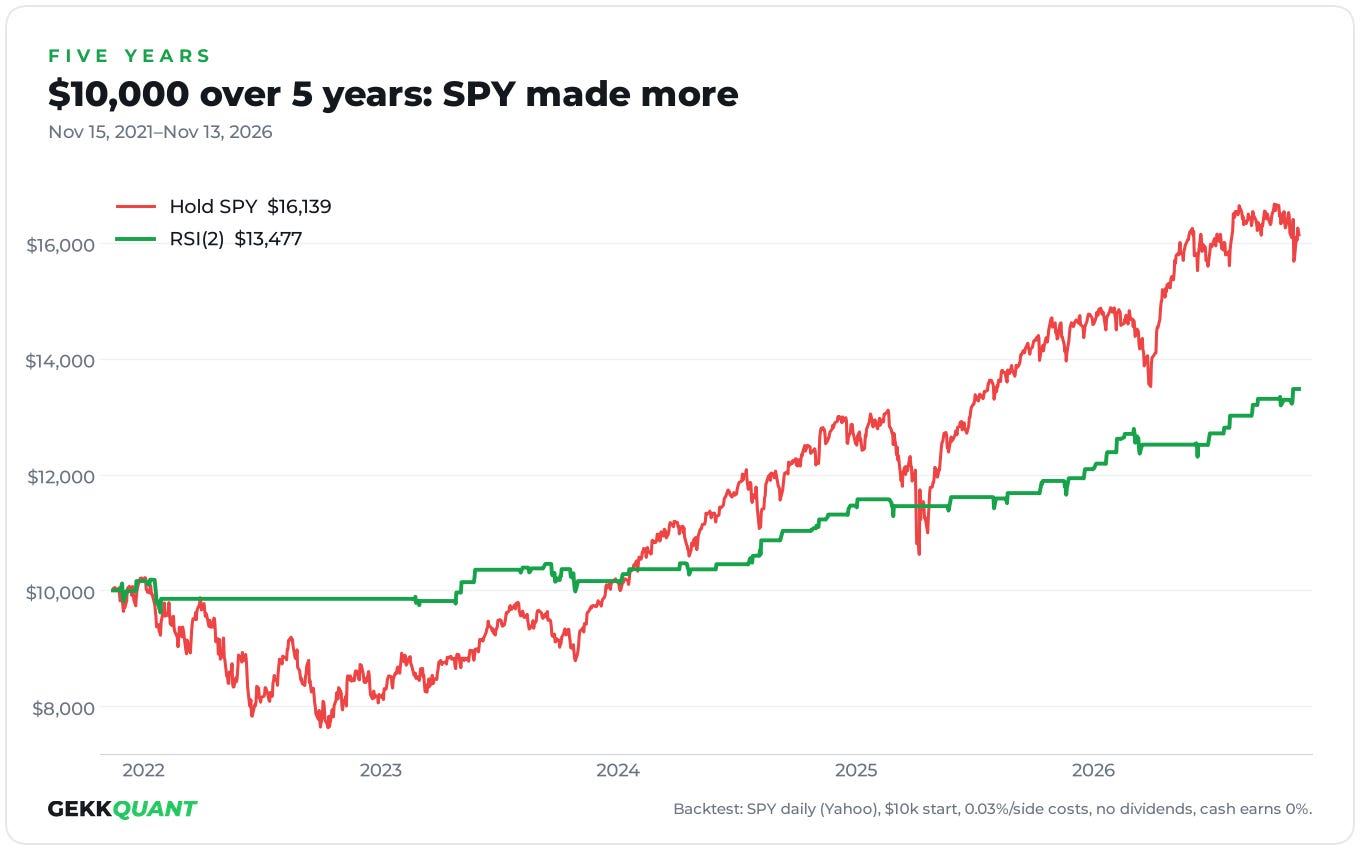
It wins about 3 trades in 4, but the winners are small, so my line climbs in steps while SPY sprints.
The drawdown
This is the chart I actually run my money off: how far below my last high I was, every day.
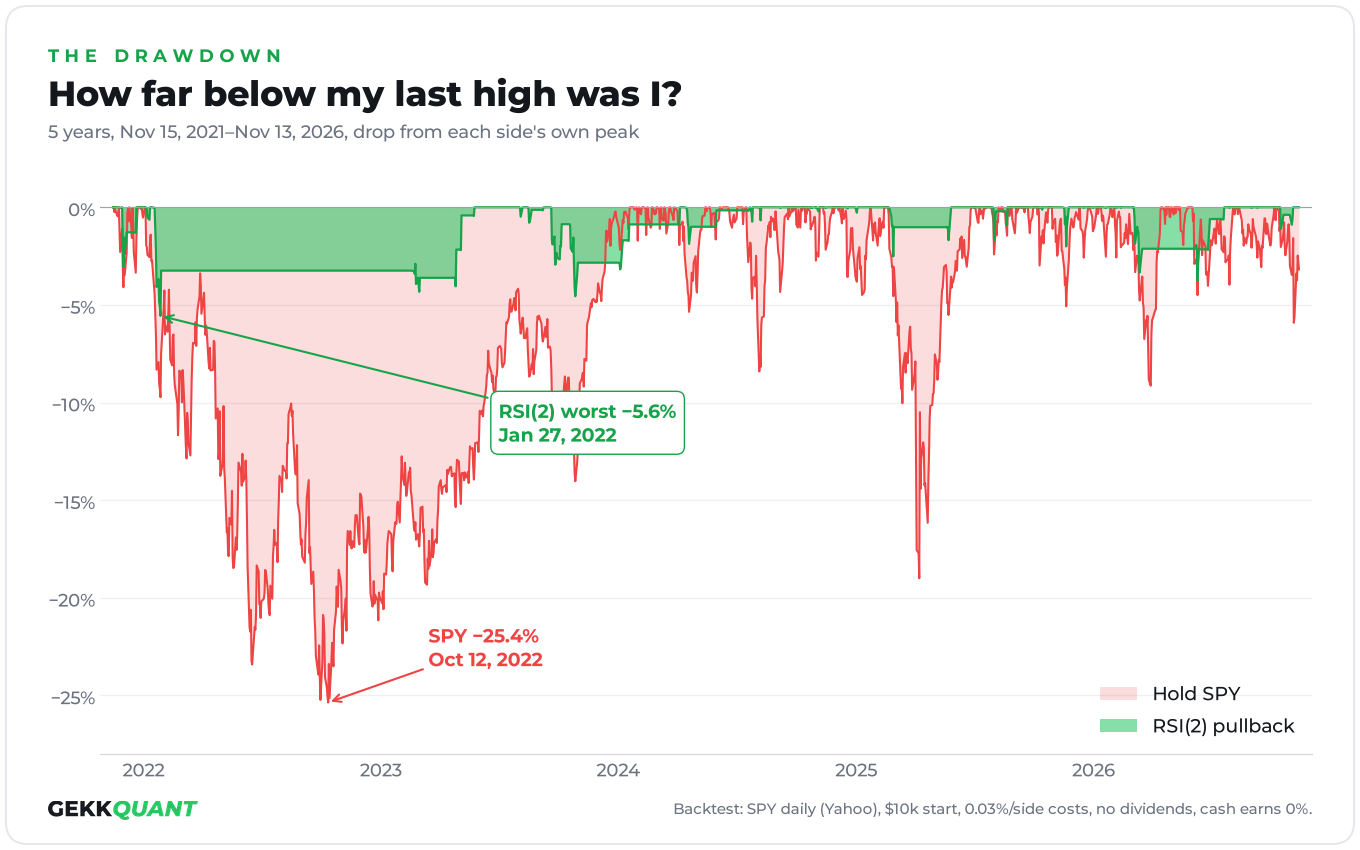
From Jan 3–Oct 12, 2022, SPY bled out a full quarter of its value. My worst hole in the entire 5 years stayed under 6%, and it came that January.
The reason is boring, and boring is the point: SPY spent most of 2022 under its 200-day average, so the filter kept me in cash.
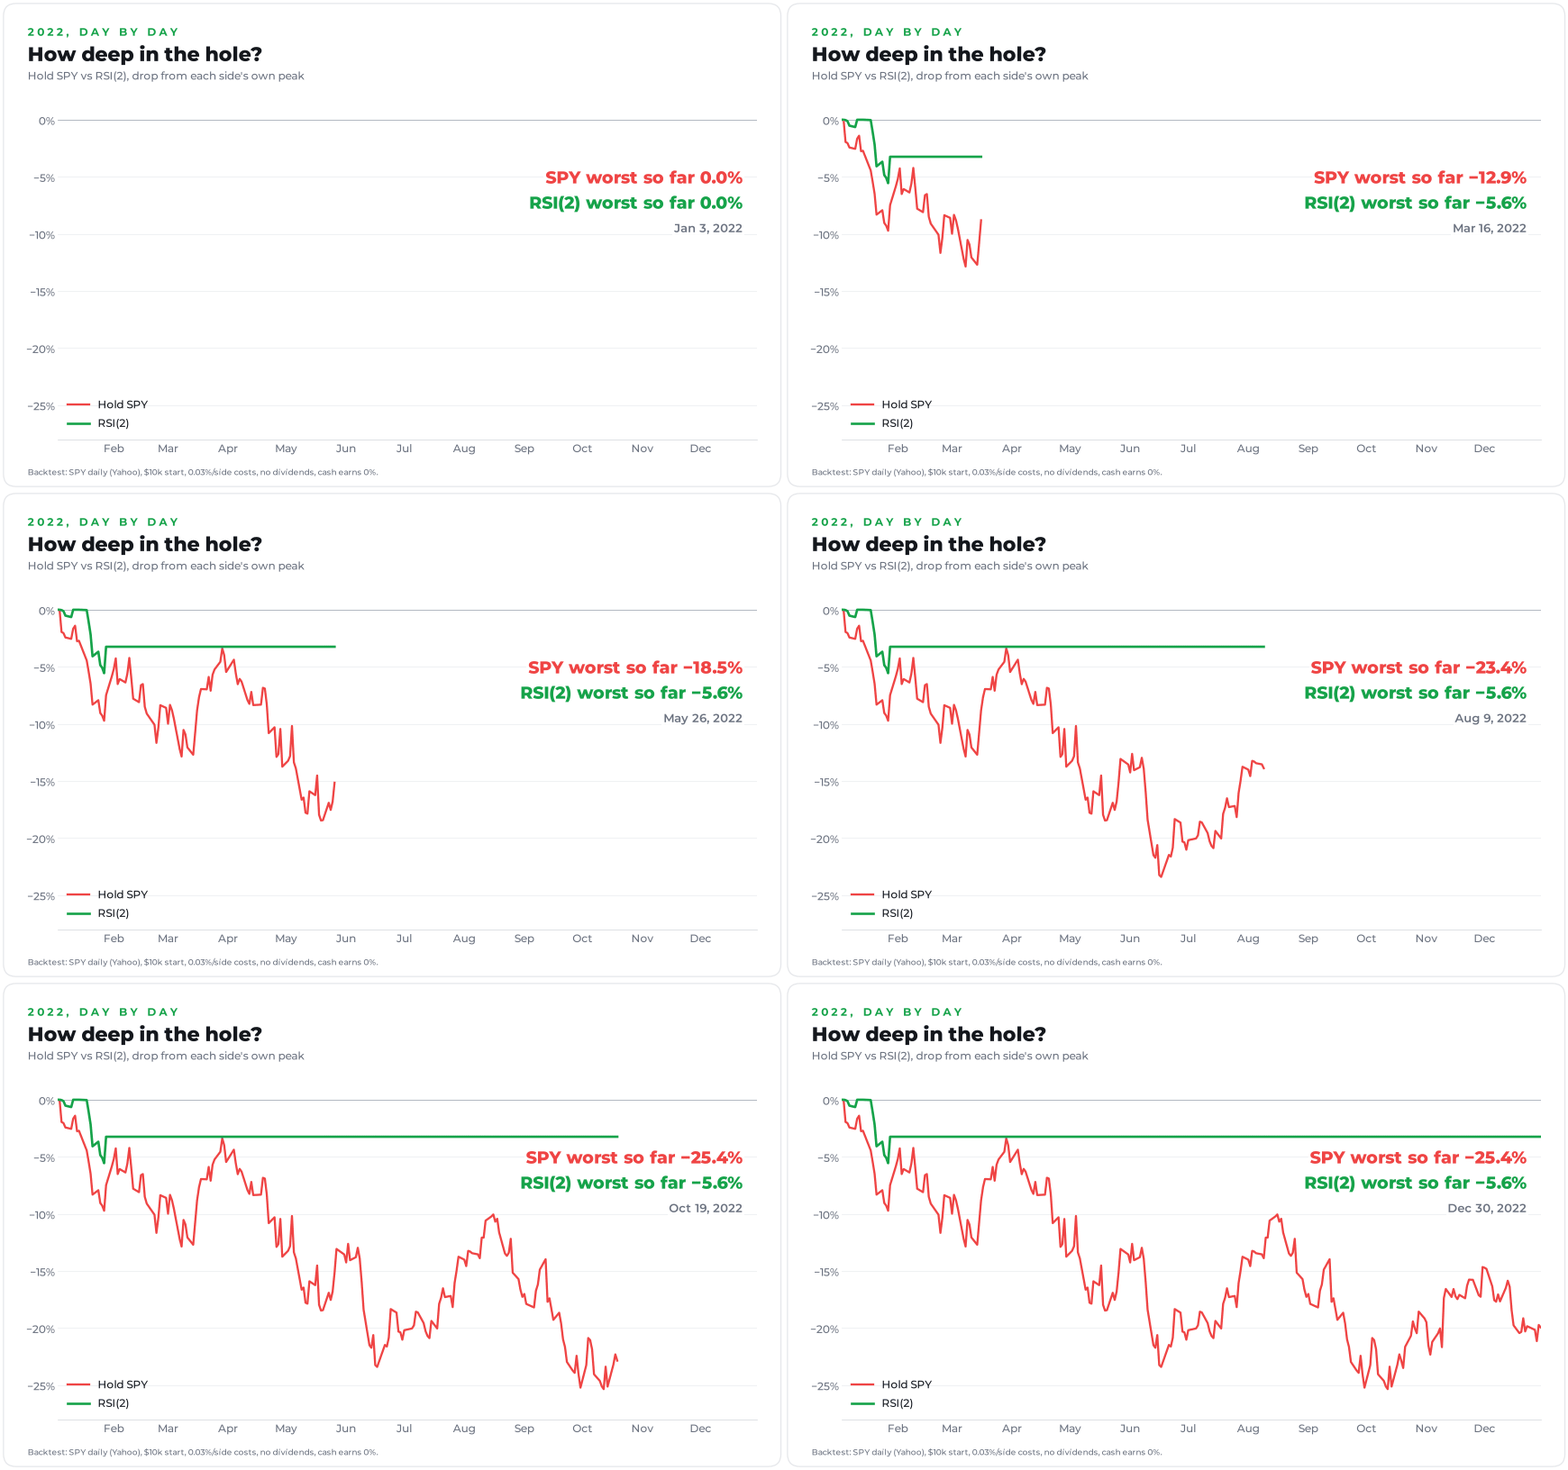
And the part nobody prints: SPY needed 746 days, until Jan 19, 2024, just to get back to its old high.
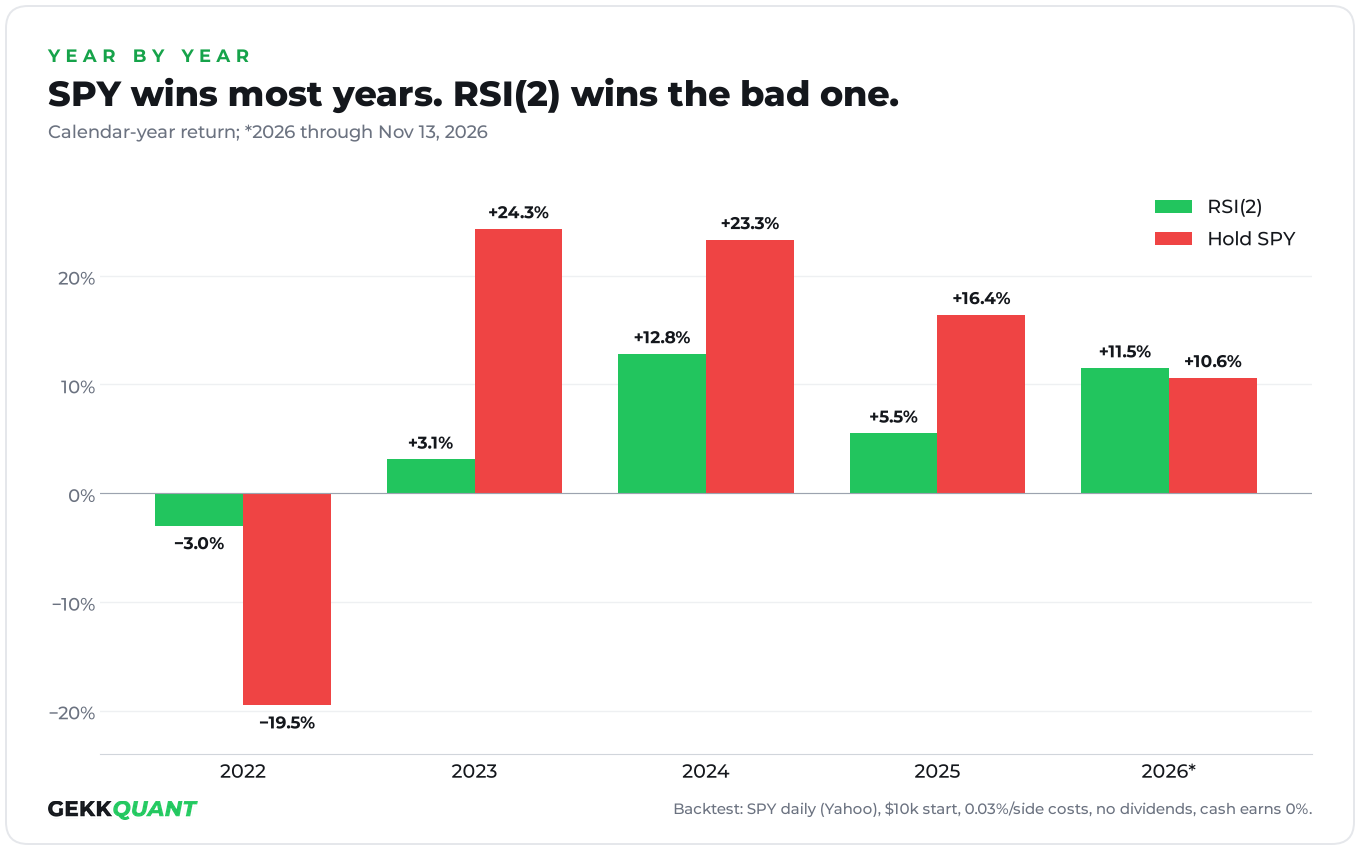
Year by year, SPY takes most of them, but in 2022 it lost almost a fifth while I gave up about 3%.
The recovery math
Losses don't climb back symmetrically. SPY's 25.4% hole needed a 34% rally just to break even, while my worst one needed barely 6%. A shallow hole is easier to sit through, and the best strategy is the one you don't dump at the bottom.
The last 3 years
The most recent stretch, Nov 14, 2023–Nov 13, 2026, tells the same story.
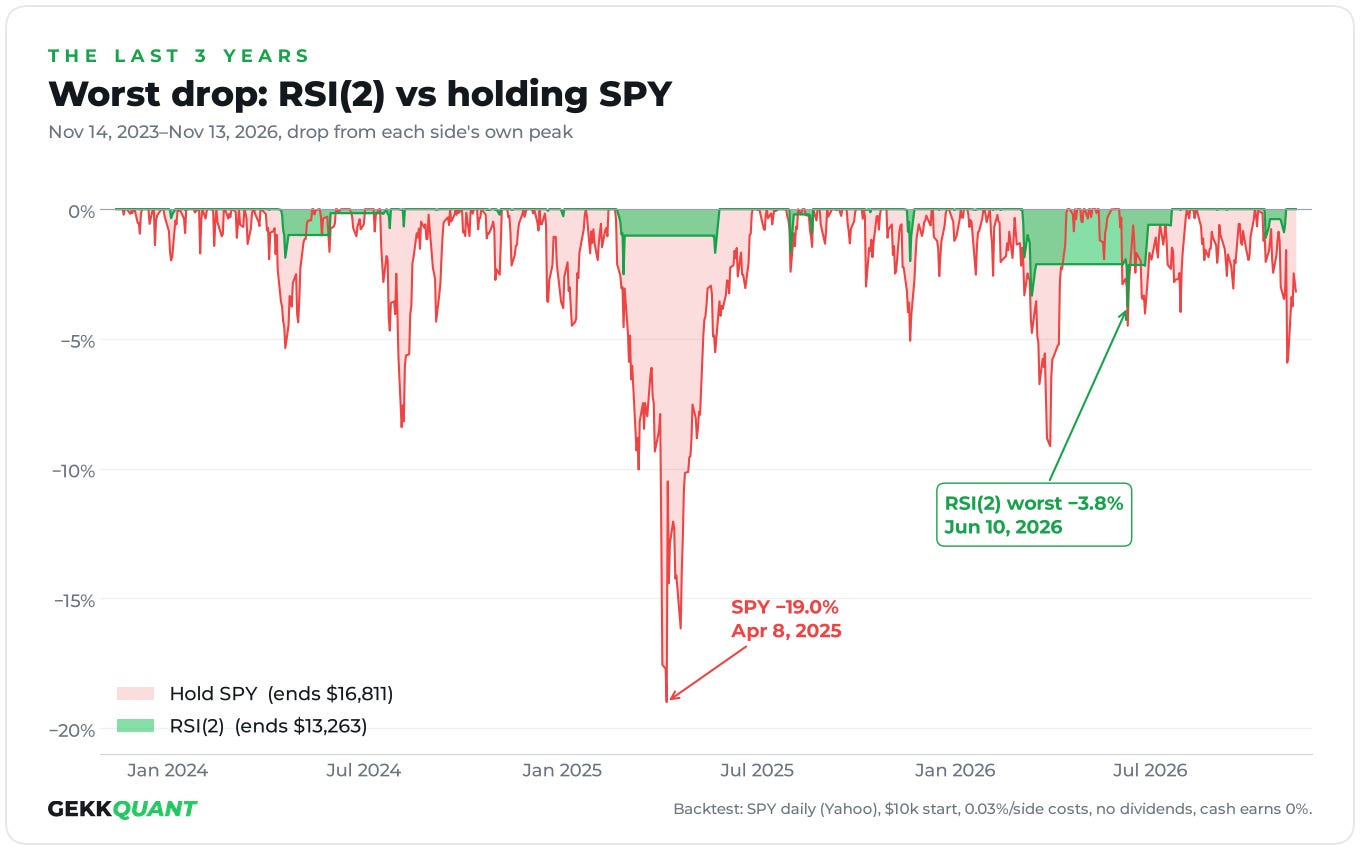
SPY's worst came in spring 2025, a 19% slide in about 7 weeks into the Apr 8, 2025 low. My worst over the whole 3 years was under 4%, and the $10,000 still grew to $13,263. SPY finished well ahead again.
What it costs me
Return. I gave up about half of SPY's 5-year gain, and that's real money.
No stop. A trade can keep running against me; my worst single one cost 3.2%, in January 2022.
Boredom. Around 10 trades a year, and the rest sits in cash that earned nothing in this backtest.
The honest caveats
I won't sell you an edge I can't prove. The shallow hole is mostly exposure: I sat in cash about 7 trading days in 8, so I missed most of the crash, and a small fixed slug of SPY you never touch is a legit alternative. I prefer a rule I can stick with, and that's a preference, not proof of an edge.

Bottom line
I'm not trying to beat SPY. I'm trying never to be 25% down.
Over 5 years I gave up roughly half the return to keep my worst drop at about a fifth of SPY's. If you can sleep through a quarter of your account vanishing, just hold SPY. I can't, so this is what I do instead.
Backtest, not a promise. Informational, not investment advice. Size and manage your own risk.
Data: SPY daily closes from Yahoo Finance, Nov 15, 2021–Nov 13, 2026, no dividends, 0.03% cost per side, cash earns 0%. Skipping dividends understates SPY by about 1.3% a year. Paying cash nothing understates the system more: I sat in cash about 7 trading days in 8, and T-bills paid roughly 4–5% a year in 2023–2025, and about 3.6–4% so far in 2026. If anything, the strategy looks better than shown. Win rate after costs.